DEBUGGING WITH GDB
Introduction to GDB
| Introduction |
| The GNU Debugger (also known as GDB) is a source-level debugger that provides the ability to debug applications at the source and machine levels |
| GDB permits the debugging of already running applications (by attaching to the application’s process ID) as well as debugging applications post-mortem. |
| Compiling for GDB |
| we’ll first need to know how to build our application so that it’s debuggable by GDB. |
| The -g flag tells the compiler to include debugging information in the image, which can be used by GDB to understand variable types (for data inspection) and machine instruction to source-line mappings. |
# gcc -g main.c -o output
The output image can now be successfully debugged via GDB |
| Using GDB |
| We’ll look at some of the most common methods for debugging with GDB using breakpoints. |
| We will assume a source c file main.c |
We compile our source with the -g flag to include debugging information for GDB, as:
# gcc -g -o main main.c
|
| Starting GDB |
To debug a program with GDB, we simply execute GDB with our program name as the first argument.
# gdb main
|
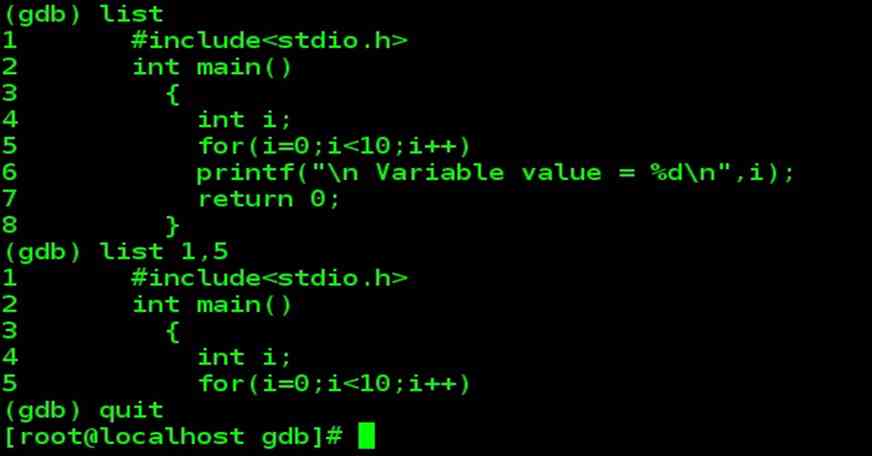
| Looking at Source
Once we start GDB, our application is not yet running, but instead is just loaded into GDB. Using the list command, we can view the source of our application, as demonstrated below: (gdb) list
|

Using Breakpoints
| Using Breakpoints |
| The primary strategy for debugging with GDB is the use of breakpoints to stop the running program and allow inspection of the internal data. A breakpoint can be set in a variety of ways, but the most common is specifying a function name. |
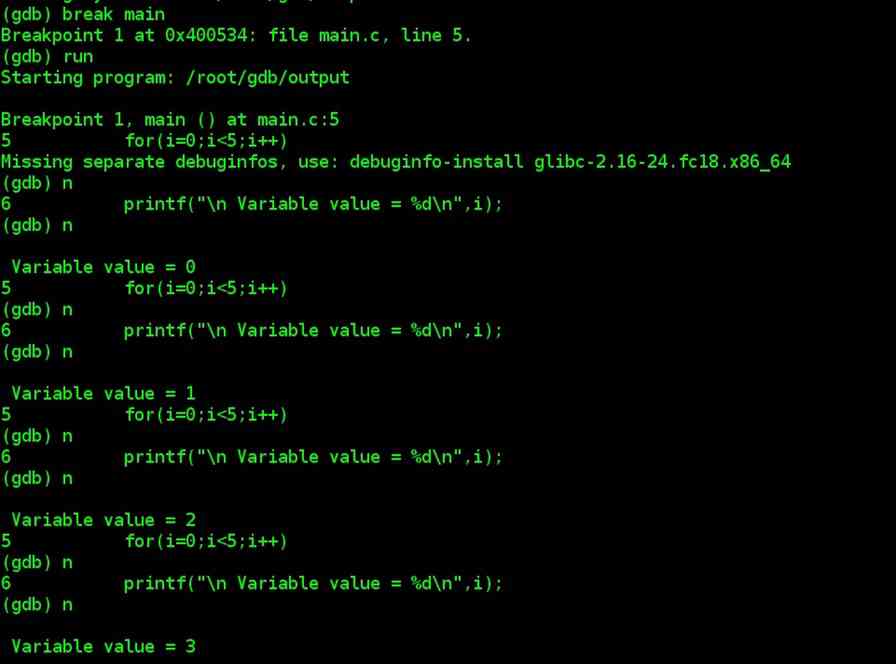
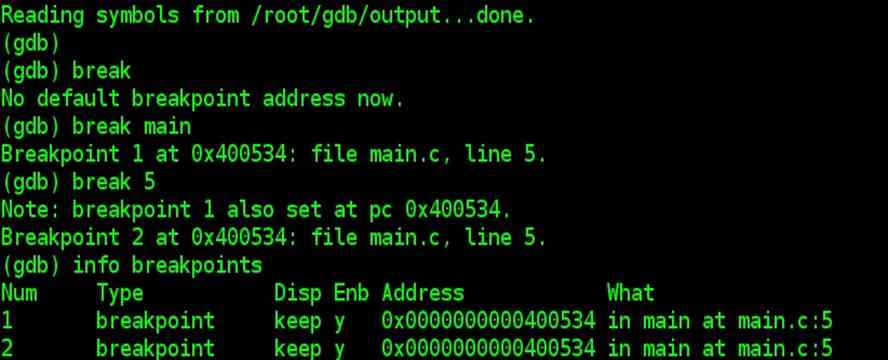
| Here, we tell GDB to break at our main function:
(gdb) break main We can use break as : (gdb) break line_number (gdb) break 5 |
| Once we give the break command, GDB tells us our breakpoint number (since we may set multiple) and the address, filename, and line number of the breakpoint. |
| We then start our application using the run command, which results in hitting our previously set breakpoint. Once the breakpoint is hit, GDB shows the line that will
be executed next. (gdb) run |
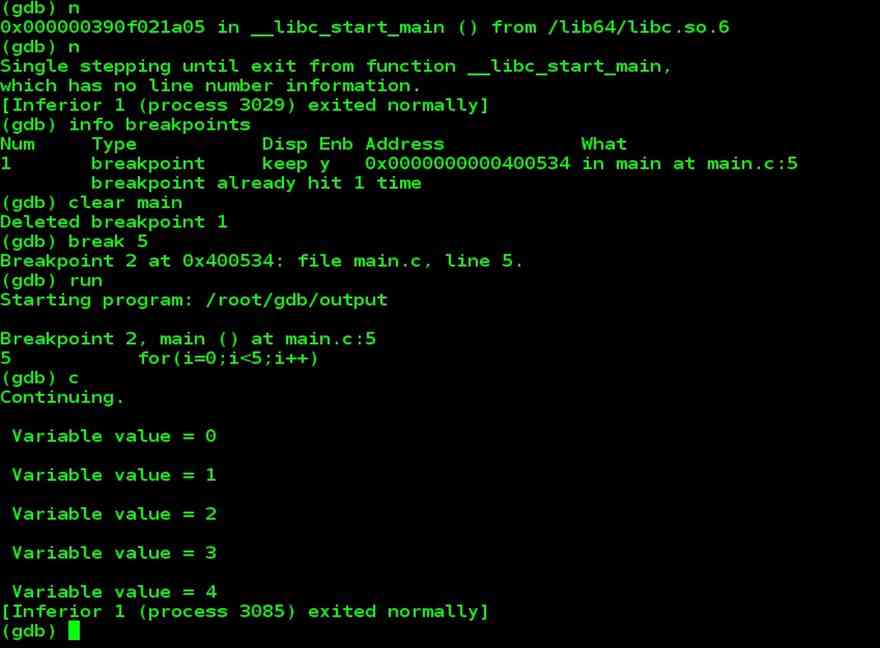
| We can view the available breakpoints using the info command:
(gdb) info breakpoints |
| If our breakpoint is now of no use, we remove it using the clear command:
clear Line_Number_of_break_point (gdb) clear 5 |
Available Methods for Setting Breakpoints
| Available Methods for Setting Breakpoints | |
| Command | Breakpoint Method |
| break function | Set a breakpoint at a function |
| break file:function | Set a breakpoint at a function |
| break line | Set a breakpoint at a line number |
| break file:line | Set a breakpoint at a line number |
| break address | Set a breakpoint at a physical address |
Stepping Through the Source
| Stepping Through the Source | |
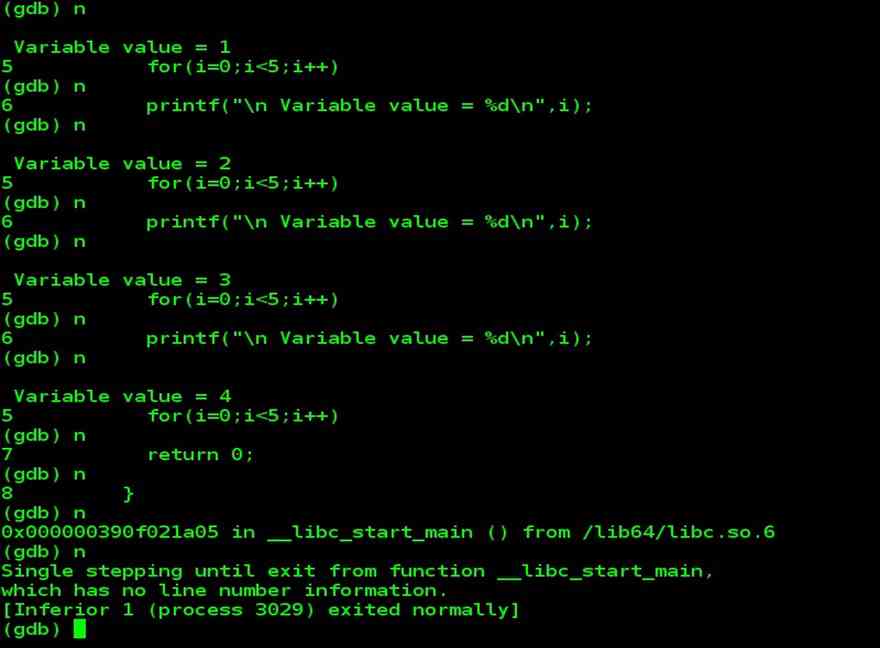
| When we left our debugging session, we had hit a breakpoint on our main function.
• To execute the next line of code, we can use the step command. This will also step into a function (if a function call is a next line to execute). • If we’d prefer to step over a function, we could use the next command, which executes the next line and, if a function, simply performs it and sets the next line to execute to the line after the function. • The cont command (short for continue) simply starts the program running. |
|
| Methods for Stepping Through the Source | |
| Command (shortcut) | Operation |
| next (n) | Execute next line, step over functions |
| step (s) | Execute next line, step into functions |
| cont (c) | Continue execution |
| Inspecting Data | |
| (gdb) display variable-name | |